
Problem source: http://community.jaspersoft.com/questions/847490/how-get-annual-growth-rate-crosstab .
As every column in a crosstab is generated dynamically, you also need to reference them dynamically when performing inter-row calculations. There is some difficulty in handling this dynamic reference using a Jasper script. But the data preparation can be made easier using esProc. Let’s look at an example.
The database table store holds sales amount of multiple products in the year 2014 and 2015. You need to display the sales amount of each product per year using a crosstab and calculate the annual growth rate of every product. Below is a selectin from original data:

esProc code:

A1: Retrieve records from the store table.
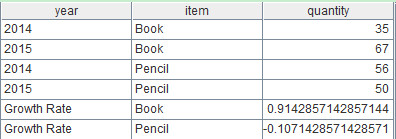
A2: Append annual growth rate of every product to A1. group is used to group data by products; run is used to perform the required calculations by loop; and record is used to append records. ~(i) represents the ith record in the current group. Below is A2’s result:
A3: Return A2’s result to the report. Reporting tools will identify esProc equipped with JDBC interface as a normal database.
Then you can create the simplest crosstab with Jasper:

Below is a preview of the finished report:

A report calls an esProc script in the same way as it calls the stored procedure. Save the above script as AnnualRate.dfx. You can invoke it with call AnnualRate () and input parameters into it from Jasper’s SQL designer.
